
What is Value Stream Mapping?
Value Stream Mapping (VSM) is the practice of mapping and visualizing the material and information flow a process to produce a service or product for a customer. It provides an overall system view of how work flows through the entire organization. It is done through the use of symbols and diagrams. Once the workflow is mapped by a cross-functional team, it can be analyzed and optimized to deliver maximum value to the customer by eliminating the wastes in the process. In short, Value stream is defined as all the activities in the process to transform a customer request into the service or product for customer
Value stream mapping also serves to reinforce system thinking. By engaging a cross-functional team in mapping the workflow that delivers values to the customer, it shows the interconnectedness of various departments/function, this allows the team to make decision that would ensure optimization across the values stream rather than optimization at each department/function which could lead to sub-optimization across the value stream
A value stream map comprises of three parts: the information flow, the process map, and the timeline. The information flow depicts the flow of information between the activities in the process map. The process map depicts the material flow and activities of the process. The Timeline documents the value added and non-value added time spent on the process which allows the calculation of process efficiency.
It is paramount to collect data on key performance metric while conducting value stream mapping. The essential metrics to collect in the value stream mapping are Lead time – the total time from the start and stop of a process, Process Cycle time – the value-added time during the process, the quality metric such as % completion without error
Value stream mapping is ideal for identifying bottlenecks in the value stream, reasons for long lead time, issues arising from interactions between the processes, build consensus on the value flows to the customer, excess /shortfall inventory
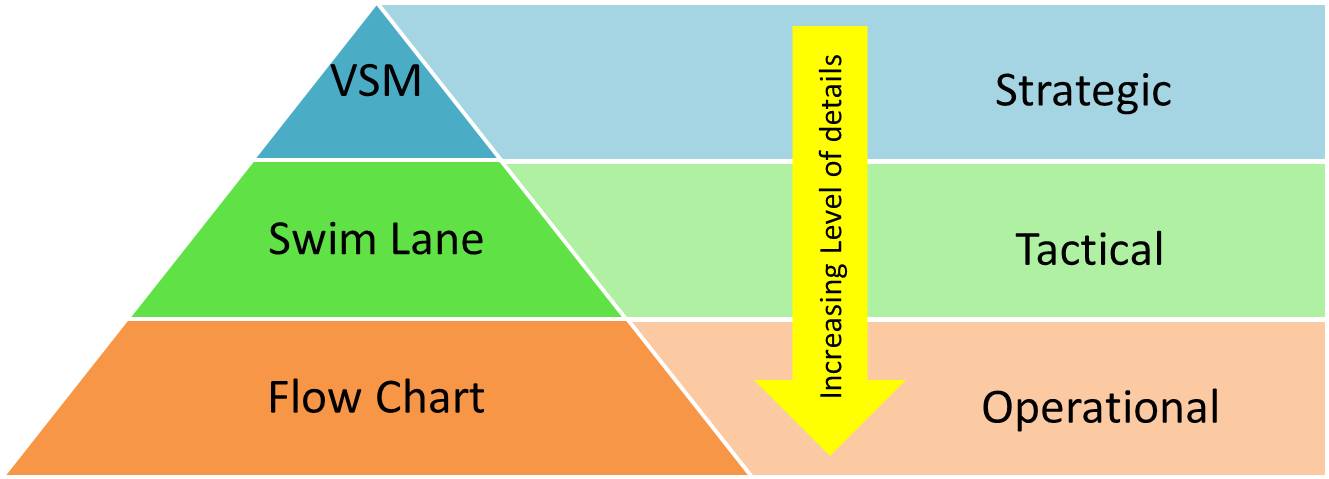
Value Stream Map, Swim Lane, and Flowchart?
Value stream mapping shouldn’t be confused with swim lane and Flowchart. A flowchart shows the sequence of steps and decisions required in a process using a series of diagrams. They are algorithmic and ideal when you would like to communicate with your software developer to automate your process. It is also used as part of a detail work instructions to guide the frontline employee in doing their job. Where else, swim lane diagram is generally a less detailed flow chart with a dedicated lane to specific the steps and decision taken by a specific person/function/department. It derived its name because the lanes on the flowchart make it looks like the lanes in a swimming pool. Swimlanes is the best tool for identifying the wastes such as handovers, over processing, defects
How do you conduct value stream mapping?
The following are the high-level steps to conduct the VSM
- Define the customer demand
- Identify the process or product that will deliver the customer demand
- Define the scope of the mapping
- Gather the team involved in the mapping
- Conduct current state mapping and collect relevant data
- Identify pain points, brainstorm and prioritize solutions
- Create future state value stream map
- Create implementation and sustenance plan
REFERENCES
- 1999, John Shook & Mike Rother, Learning to See: Value Stream Mapping to Add Value and Eliminate MUDA
- 2002, James P.Womack & Daniel T.Jones, Seeing the Whole: Mapping the Extended Value Stream
- 2013, Karen Martin & Mike Osterling, Value Stream Mapping: How to Visualize Work and Align Leadership for Organizational Transformation